![]() ISSN: 1885-8031
ISSN: 1885-8031
https://dx.doi.org/10.5209/REVE.84391
Análisis del comportamiento de las cooperativas: de la Gran Recesión a la crisis del COVID-19
Mercè Sala Ríos[1]![]()
Recibido: 17 de enero de 2022 / Aceptado: 7 de junio de 2022 / Publicado: 9 de noviembre de 2022
Resumen. El estudio se centra en las cooperativas españolas a lo largo del período (2008-2020). Como vemos, en él están incluidos los años de la Gran Recesión, los años de auge que siguieron y el, hasta la fecha, peor año de la crisis del COVID-19. El objetivo general es evaluar el comportamiento de las cooperativas desde la crisis financiera hasta 2020. Este objetivo se desglosa en tres objetivos específicos: i) Analizar los efectos de la crisis sanitaria en el número de cooperativas y en el empleo dentro de las mismas. ii) Analizar los cambios en el desempeño económico de las cooperativas, representado por los índices de rentabilidad económica y financiera. iii) Evaluar si la pertenencia a un determinado sector de actividad afecta a la rentabilidad de las cooperativas. Los resultados indican que la crisis de 2008 y la pandemia del COVID-19 incrementaron el comportamiento procíclico del empleo cooperativo. Sin embargo, el autoempleo fue menos elástico que el empleo asalariado. Los resultados de rentabilidad muestran que la crisis del COVID-19 no afectó consistentemente la rentabilidad económica y financiera de las cooperativas. El sector agroalimentario resistió la Gran Recesión y mostró un comportamiento contracíclico en el año de la pandemia.
Palabras clave: Cooperativas; España; Gran recesión; COVID-19; Rentabilidad.
Claves Econlit: D22; J54; L23; L31; M21.
[en] Performance of spanish cooperatives: from the Great Recession to the COVID-19 pandemic
Abstract. This is study is focused on Spanish cooperatives. The data span thirteen years (2008-2020). It includes the Great Recession, the upturn years that came after it, and the worst year of the COVID-19 crisis to date. The aim is to evaluate cooperatives’ performance from the financial crisis to 2020. This aim is broken down into three specific objectives: i) To analyse the effects of the health crisis on the number of cooperatives and on employment within them. ii) To analyse changes in cooperatives’ economic performance, represented by economic and financial profitability ratios. iii) To assess whether belonging to a given activity sector affects cooperatives’ profitability. The results indicate that the 2008 crisis and the COVID-19 pandemic increased the pro-cyclical behaviour of cooperatives’ employment. However, self-employment was less elastic than salaried employment. The profitability results show that the COVID-19 crisis did not consistently affect cooperatives’ economic and financial ratios. Agri-food sector withstood the Great Recession and displayed a counter-cyclical behaviour in the pandemic year.
Keywords: Cooperatives; Spain; Great Recession; COVID-19; Profitability.
Summary. 1. Introduction. 2. Unique features of cooperatives: strengths and weaknesses. 3. Data sources. 4. Main results. 5. Conclusions. 6. References.
How to cite. Sala-Ríos, M. (2022) Performance of spanish cooperatives: from the Great Recession to the COVID-19 pandemic. REVESCO. Revista de Estudios Cooperativos, vol. 142, e84391. https://dx.doi.org/10.5209/reve.84391.
The health crisis caused by COVID-19 has had an impact on both the supply and demand sides of the economy. Although the pandemic was ongoing at the time of writing, many studies and evaluations of its effects on the economy and firms had already been conducted. There is general agreement on its uncertain, deep and global nature: “The pandemic constitutes a unique disturbance in recent economic history due to its global character and to the symmetrical nature of the original shock” (Prades Illanes and Tello Casas, 2020: 9). Likewise, among experts addressing the topic, there is significant unanimity in accepting that the nature of such studies is preliminary, and that they should be reviewed and updated as the pandemic itself evolves.
This is a preliminary study focusing on the Spanish social economy. We are aware of the fact that the pandemic has intensified the socioeconomic problems that societies were already facing. The COVID-19 crisis and its consequences once again place the social economy at the heart of the debate. “On the economic side, there is a toxic cocktail of marked inequality, stagnating productivity, and organizational inefficiency. These are significant negatives in the context of technological disruption and growing global competitiveness where business must more than ever be innovative and resilient. On the social side, there are large differences in levels of opportunity and well-being among different generational, regional and social class categories, and those in authority are widely distrusted. Adding to this dystopian scene are underlying trends that pose existential threats to the population at large, namely environmental degradation and climate change, which decision-makers are failing to address with sufficient urgency” (Child, 2021: 118).
The social economy should play an essential role in the pandemic and post-pandemic economies. The OECD (2020) distinguishes three different phases that give rise to different actions: i) Urgent response phase (first weeks), ii) Consolidation phase (first months), and iii) Transformational phase (during and post-COVID).[2] In the latter, the social economy should take on a higher profile “to inspire transformation to a more inclusive and sustainable economy and society” (OECD, 2020: 2). Faced with this scenario, a question arises: How has the COVID-19 crisis affected social economy entities?
This study partly addresses this question. We focus on Spanish cooperatives, which represent more than 40% of Spain’s social economy entities. We present an economic analysis that includes the effect of the COVID-19 pandemic. Specifically, the data span thirteen years (2008-2020). The 13-year period was selected because it includes the Great Recession, the upturn years that came after it, and the worst year of the COVID-19 crisis to date. The aim is to evaluate cooperatives’ performance from the financial crisis to 2020. This aim is broken down into three specific objectives:
ii) To analyse changes in cooperatives’ economic performance, represented by economic and financial profitability ratios.
iii) To assess whether belonging to a given activity sector affects cooperatives’ profitability.
The objectives are linked because firms’ profitability is a crucial factor in terms of guaranteeing their survival in the medium and long terms, and of strengthening them to ensure they are able to face future shocks (Alarussi and Alhaderi, 2018; Andrés González-Moralejo et al., 2021; Blanco et al., 2020; González et al., 2002; Işık, 2017).
Interest in this study lies in the fact that cooperatives have a long tradition in Spain. Although the figures indicate that they still have a long way to go, in past recessions they have shown greater resilience and have shed fewer jobs than other entities within the Spanish economy as a whole (Calderón Milán and Calderón Milán, 2012; Díaz and Marcuello, 2010; Sala-Ríos et al., 2020a; Sala et al., 2015). In our opinion, analysing the effects of the pandemic on cooperatives is essential. These preliminary studies will help to assess what the pandemic has meant, and also to assess how successful the various measures taken to deal with it have been.[3]
The remainder of the paper is organised as follows. Section two reflects on the unique features of cooperatives. Study data and sources are presented in section three. Section four presents the main results. We conclude and discuss the main results in section five.
2. Unique features of cooperatives: strengths and weaknesses
In line with the provisions of the International Cooperative Alliance, Spanish Law 27/1999, of 16 July, on cooperatives defines a cooperative as “a democratically structured and operated enterprise formed by persons who associate with it freely, or leave it voluntarily, for the purpose of carrying out business activities aimed at meeting their financial and social needs and aspirations”. A cooperative is therefore a participatory and democratic organisation by nature.
As an alternative organisational model to that of capitalist firms, cooperatives are governed by democratic and participatory principles in order to generate well-being (Bretos et al., 2020; Guzmán et al., 2019, 2020). Cooperatives are firms that have social objectives in a for-profit environment (Birchall and Ketilson, 2009; Carini and Carpita, 2014). “They must face the challenge of harmonising objectives linked to democracy with those linked to profit. This duality between business and democracy becomes a dynamic and unstable equilibrium” (Sala-Ríos et al., 2020b: 2). There is no doubt that the simultaneity of cooperation and competition, the so-called ‘coopetition’, becomes a key factor in increasing their economic opportunities (Basterretxea et al., 2019).
While cooperatives’ participatory and democratic values reinforce them, they may trigger weaknesses. Indeed, as an alternative organisational model, their strengths and weaknesses should be made explicit. Among the former, we would highlight their greater stability in terms of employment and wage flexibility. Cooperatives are more reluctant to fire employees and are more likely to adjust working hours. In addition, they are more mindful of gender equality and inclusion, which creates better quality employment (Calderón and Calderón, 2012a; Díaz and Marcuello, 2010; Lampel et al., 2012; Roelants et al., 2012; Román, 2014). Some authors like Lampel et al. (2014) or Park et al. (2004) recognise that better job security is a factor that makes employees keener to improve and acquire new skills, which in turn has the potential to increase cooperatives’ human capital and even results.[4]
Moreover, their strong sense of identity based on their knowledge of the territory in which they operate is presented as a strength (Vo, 2017). Their local dimension increases their link with the territory, which associates them directly with local development (Melian and Campos, 2010; Tarazona and Albors, 2005). In addition, they tend to show greater commitment to sustainable and responsible consumption and growth (Fusco and Migliaccio, 2018).
Another key issue is the relationship between cooperatives and the business cycle. A large number of studies recognise that cooperatives have a counter-cyclical behaviour, making them a defensive tool against downturn periods and exerting a refuge effect (Birchall and Ketilson, 2009; Boone, Christophe; Özcan, 2014; Calderón and Calderón, 2012b; Carini and Carpita, 2014; Cornforth and Thomas, 1995; Demoustier, 2000; Grávalos and Pomares, 2001a; Monzón, 2012; Roelants et al., 2012; Román, 2014).
However, this organisational model is not without its problems or weaknesses. Regarding the greater resilience referred to further above, some authors have either qualified or have not been able to find any significant interaction between cooperatives’ employment and the economic cycle (Ben-Ner, 1988; Díaz and Marcuello, 2010; Pérotin, 2006; Sala Ríos et al., 2014).
There is an interesting debate about what lies ahead for cooperatives in terms of their life cycle. “Growing economic requirements and managerialism trends associated with a competitive market economy and a neoliberal ideology have permeated many cooperatives, imposing unavoidable pressures towards degeneration” (Bretos et al., 2020: 436). Cooperatives are distinguished from capitalist firms because they have both business and social goals. If the former disappear, the associative part persists. However, if the latter disappear, a cooperative cannot be deemed as such (Coque, 2008). Although it is possible to mobilise resources and efforts to regenerate the principles and values of cooperatives (Bretos and Marcuello, 2017), the risk of falling into a degenerative process should be borne in mind when evaluating whether a cooperative is a viable alternative model.
The peculiarities of the financial structure of cooperatives can also lead to weaknesses. First, cooperatives’ criteria for profit sharing may be seen as a disadvantage compared to capitalist firms. Cooperatives must provide mandatory social funds that cannot be distributed among members, even in the event of dissolution. Second, cooperatives have a lower level of capitalisation[5] and a higher level of indebtedness than capitalist firms (Bastida, 2012). Third, their share capital is variable, due either to contributions being returned to members leaving, or to the allocation of losses. In capitalist firms, share capital is governed by the principle of stability. Accordingly, share capital is stable and may only be modified in compliance with current regulations and established legal requirements, so it is a minimum and basic guarantee for third parties.
Lower capitalisation and variable share capital make it difficult to access bank borrowing (Bastida, 2012). In addition, lenders perceive greater risk in cooperatives and are therefore more reluctant to grant loans or more likely to impose tougher borrowing conditions. As might be expected, this limitation is a handicap for investment and innovation (Bretos et al., 2018; Guzmán et al., 2019; Sala-Ríos et al., 2018).
As we can see, the reality of cooperatives is a difficult balance between social and profit goals. This study sits within this balancing act since we analyse cooperatives from the perspective of ratios designed for and by capitalist firms. However, we should not forget that cooperatives’ survival depends on making their democratic and participatory principles compatible with the strategies of capitalist firms.
3. Data sources
The data span the 2008-2020 period. The 13-year period was selected because it includes the Great Recession, the upturn years that came after it, and the worst year of the COVID-19 crisis to date. The data sources depend on the objective in question.
First objective: The data come from the Social Economy Statistics of the Spanish Labour and Social Economy Ministry. The data span the 2008-2020 period and relate to Spanish cooperatives as a whole, without distinction between activity sector or qualification. The statistics are published quarterly, and we used those of the last quarter of the year, except for 2020, for which we used the latest information available (the second quarter). It is necessary to clarify certain aspects of the figures. Worker-members of associated work cooperatives can choose to make social security contributions under the General Social Security Scheme or the Special Self-employed Scheme. On the one hand, the statistics produced by the Ministry of Labour and Social Economy provide information about cooperative members that contribute to the Special Self-Employed Scheme and the estimated number of cooperatives whose total workforce comes under this Scheme. We will refer to these data as ‘S-cooperatives’. On the other hand, the statistics also provide information about the number of cooperatives and employees that contribute to the General Social Security Scheme. Employees include cooperatives’ worker-members and salaried workers.[6] We will refer to these data as ‘G-cooperatives’.
Second and third objectives: The data are yearly and span the 2008-2020 period. They come from the Iberian Balance Sheet Analysis System (SABI) generated by Bureau van Dijk. We selected all active cooperatives in 2020. Initially, the sample consisted of 432 cooperatives. After removing extreme and inconsistent values and those with missing information, our final sample is made up of 369 cooperatives.
As described, different statistics are used for each objective. These are not homogeneous, neither in the way the information is collected nor in terms of the cooperatives making up the sample. However, there is no other way of approaching the analysis. The results should be taken as trends and cannot be combined in any assessment. We are aware of these limitations; however, this does not detract from our desire to conduct studies on cooperatives.
4. Main results
4.1. First objective: To analyse the effects of the health crisis on the number of cooperatives and on employment within them
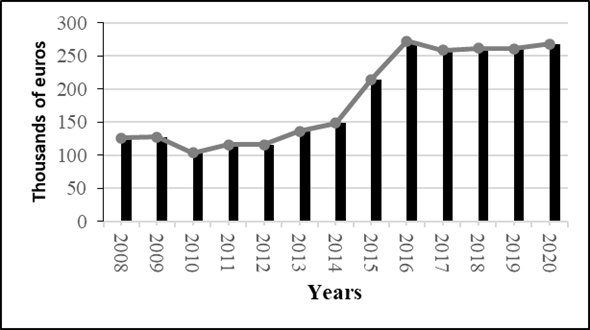
We begin by analysing the evolution of the number of cooperatives and of employment within them from the 2008 financial crisis to the latest available information in 2020. Figures 1 and 2 show the annual variation rates of the number of cooperatives and of employment within them. The 2020 variation rates were -3.22% and -9.73%, respectively. The employment variation rate was higher than those of the worst years of the Great Recession. For the Spanish economy, data on non-financial firms from the Bank of Spain’s Central Balance Sheet Data Office Quarterly Survey indicated that the number of firms had decreased by 13.35% and that employment had fallen by 5.63%.[7] Although the data are not directly comparable, since the cooperative figures are from the second quarter of 2020 and those of the Central Balance Sheet Data Office are calculated as the mean of the last four quarters, they do allow us to intuit that losses were less acute for cooperatives than they were for employment.
If we distinguish between S-cooperatives and G-cooperatives, we can see different behaviours. From the start of the Spanish economy’s recovery (around 2015) to 2017, when growth was consolidated, the rates of variation in the number of G-cooperatives were quite stable, whereas those of employment were more pronounced. Both were positive, however. The COVID-19 crisis broke this trend, with falls of 3.74% for cooperatives and 12.05% for employment. The evolution was different for S-cooperatives. The economic recovery period was linked to lower positive rates, especially in employment. Instead, they improved in times of crisis. Thus, in the year 2020, the variation rate of the number of cooperatives was -2.24%, 15 percentage points higher than that of the previous year, and the variation rate of employment was -1.58, 12 percentage points higher than that of the previous year.
Figure. 1. Number of cooperatives: Variation rates
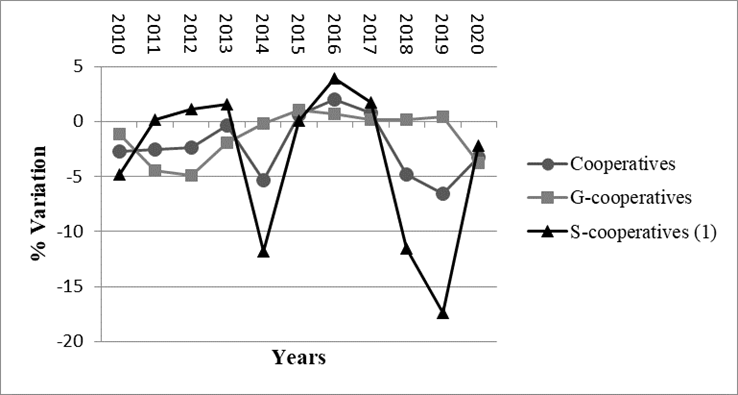
(1) Estimated number of cooperatives whose entire workforce comes under the Self-employed Social Security Scheme.
Source: CEPES and Ministry of Labour and Social Economy.
Figure. 2. Employment: Variation rates
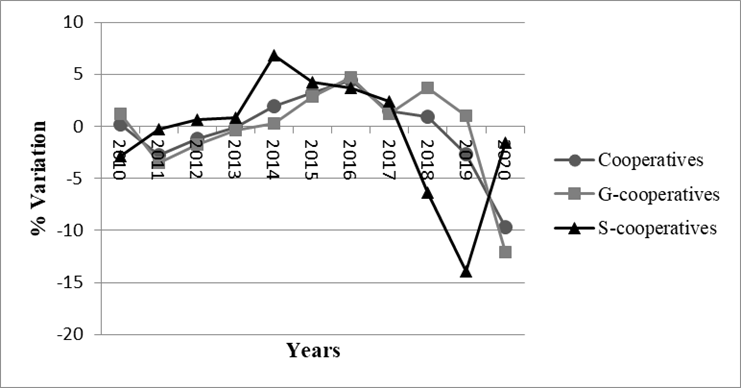
Source: CEPES and Ministry of Labour and Social Economy.
Given these results, some preliminary reflections can be made. First, cooperatives did not show resilience when facing the COVID-19 crisis. Employment did not demonstrate a refuge effect as it had done in other downturns, and even led to a counter-cyclical behaviour. See, for example, Calderón and Calderón (2012a), (2012b); Cornforth and Thomas (1995); Demoustier (2000); Díaz-Foncea and Marcuello (2015); Grávalos and Pomares (2001a); Monzón (2012); Román (2014); Sala et al. (2015).
Second, the significant losses of cooperatives and employment were largely among G-cooperatives. S-cooperatives displayed the counter-cyclical phenomenon typical of the self-employed: “… Self-employment during contraction phases would serve as a ‘refuge’ for the unemployed from other work situations. Thus, self-employment would increase in recessions (a proportion of salaried employees who had been dismissed would move towards self-employment) and decrease in boom times (some of the self-employed would give up self-employment when they got a salaried job)” (Cuadrado Roura et al., 2005: 197). Also, in downturn periods, another way of dealing with problems is to transform firms into cooperatives (Calderón and Calderón, 2012a, 2012b; Díaz and Marcuello, 2010; Martín and Lejarriaga, 2011; Sala Ríos et al., 2014). Within the Spanish labour market, these phenomena have been empirically demonstrated in studies such as those by Cuadrado Roura et al. (2005) or González Morales (2009).
In addition, in Spain, the greater resilience of S-cooperatives’ employment may be linked to the fact that worker-members can only benefit from the Special Self-employed Scheme. As noted by (Díaz-Foncea and Marcuello, 2013), their employment is less elastic to the decline in economic activity than that of salaried workers. G-cooperatives also arise from self-employment (Melian and Campos, 2010), hiring employees takes longer.[8]
4.2. Second objective: To analyse changes in cooperatives’ economic performance, represented by economic and financial profitability ratios
We use two ratios, economic profitability and financial profitability. We perform the analysis from the perspective of profitability being a fundamental factor for the survival of firms. The two ratios were chosen because “they surely are the most relevant and widespread economic, or better profitability ratio” (Fusco and Migliacio, 2018: 4). Economic profitability is an indicator of a firm’s effectiveness to take advantage of its investments. It is among the most analysed indicators for evaluating not only investment projects, but also the management of firms (Castro et al., 2019). Financial profitability indicates the ability to make a profit in relation to own funds.
We measure economic profitability (EP) as the return on total assets. We compare earnings before taxes (EBT) with total assets (TA). Our indicator is a variant of ROI (return on investments) and differs from the way it is normally calculated. In fact, it is usually calculated using EBIT (earnings before interest and taxes). Our method of calculation follows the one by (Sánchez, 1994: 162): “excluding the impact of financial costs from the calculation of economic profitability implies ignoring the extent to which a firm’s ability to obtain financial resources, ...., affects its economic aspects.”
![]()
This ratio can be broken down into two components, margin (M) and rotation (R). Margin is defined as the relation between earnings before taxes (EBT) and turnover (T). Rotation reflects the number of times that turnover covers total assets. It is a measure of efficiency in the use of assets to generate income. Economic profitability can then be enhanced by margin, rotation or both.
![]()
We use the return on equity ratio (ROE) to calculate financial profitability (FP). This ratio divides earnings before taxes (EBT) by own funds (OF). The ROE is an accounting approximation of the return on own resources. It can also be disaggregated as follows:
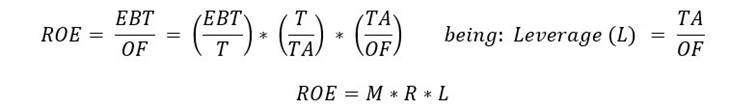
Table 2 shows the patterns followed by economic profitability and its two components: margin and rotation. The figures show the ratios of the means:
![]()
The results firstly show an increase in EP, especially between 2011 and 2016, and secondly a non-significant loss of profitability in 2020 compared to the pre-pandemic years.
Table. 2. Economic profitability and explanatory factors
|
EP |
M |
R |
Margin effect1 |
Rotation effect2 |
Interaction effect3 |
|
|
2008 |
1.27% |
0.72% |
1.77 |
|||
|
2009 |
1.55% |
0.93% |
1.67 |
0.00385 |
-0.00075 |
-0.00023 |
|
2010 |
1.34% |
0.82% |
1.63 |
-0.00186 |
-0.00034 |
0.00004 |
|
2011 |
1.48% |
0.85% |
1.74 |
0.00052 |
0.00086 |
0.00003 |
|
2012 |
1.58% |
0.90% |
1.76 |
0.00075 |
0.00020 |
0.00001 |
|
2013 |
1.75% |
0.98% |
1.79 |
0.00145 |
0.00030 |
0.00003 |
|
2014 |
1.90% |
1.08% |
1.77 |
0.00178 |
-0.00026 |
-0.00003 |
|
2015 |
2.27% |
1.30% |
1.74 |
0.00392 |
-0.00024 |
-0.00005 |
|
2016 |
2.91% |
1.68% |
1.73 |
0.00671 |
-0.00018 |
-0.00005 |
|
2017 |
2.68% |
1.54% |
1.74 |
-0.00247 |
0.00011 |
-0.00001 |
|
2018 |
2.72% |
1.56% |
1.74 |
0.00039 |
0.00000 |
0.00000 |
|
2019 |
2.70% |
1.54% |
1.75 |
-0.00041 |
0.00021 |
0.00000 |
|
2020 |
2.66% |
1.54% |
1.73 |
-0.00001 |
-0.00035 |
0.00000 |
1. Margin effect = (M2-M1) * R1
2. Rotation effect = (R2-R1) * M1
3. Interaction effect = (M2-M1) * (R2-R1)
(EP2-EP1) = 1+2+3
Source: Own elaboration. Data from SABI
Data from non-financial firms show that, in 2020 compared to 2019, economic profitability fell by more than 2 percentage points from 6.8% to 4.6%.[10] In addition, the percentage of firms with negative profitability increased by 8 percentage points, reaching 34% (Banco de España, 2021). These tendencies were not observed in cooperatives. Their economic profitability did not decrease, and the percentage of cooperatives showing negative profitability was 26%, 8 percentage points less than that of non-financial firms. Thus, compared to non-financial firms, cooperatives’ economic profitability displayed greater resilience to the effects of the pandemic.
This greater resilience was also observed in the Great Recession. Between 2008 and 2012, the profitability of non-financial firms fell by almost 3 percentage points. In contrast, cooperatives’ profitability only showed signs of weakness in 2010, falling by less than half a percentage point. In 2011, the ratio had already recovered.
Despite this good performance, the problem lies in the low figures of cooperatives’ profitability. During the pre-pandemic years, the highest values were under 3%, while those of Spanish non-financial firms were around 6%.[11]
As can be seen in Table 2 and Figure 3, the margin effect is the key factor determining the behaviour of economic profitability. The year 2020 is the exception since the little variation in profitability is explained by rotation.
Figure. 3. Explanatory factors of economic profitability
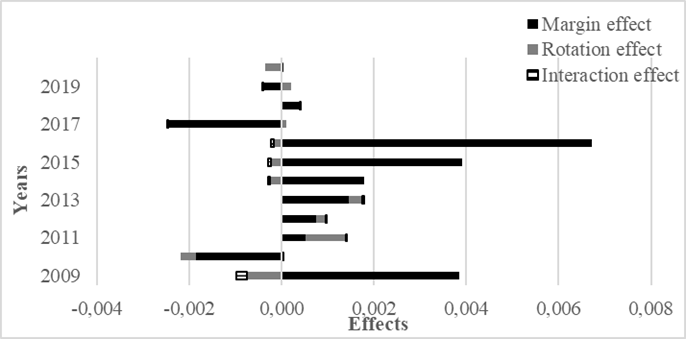
Source: Own elaboration. Data from SABI
In this sense, it is important to highlight that “in terms of achieving higher economic profitability, the joint variations of gross margin and rotation were found to have greater efficiency compared to one of them remaining constant. A firm, within its possibilities and within the nature of its activity, must try to establish a strategy that takes into account the favourable evolution of both components and not just the achievement of one of them alone” (Vázquez Rodríguez, 2005: 304). This is not the case for cooperatives, which, by basing their profitability more on margin than on rotation, makes them highly dependent on results, which is a weakness despite their greater resilience in times of crisis.
In fact, during the period studied, profits performed adequately. Figure 4 shows their evolution. The worst figure is not that of 2020 but that of 2010. After that trough, the best result can be found in 2016, when profits were more than twice those of 2010 (an increase of 162.8%). In 2020, the drop compared to 2016 was only 1.5%. Pending more definitive statistics, our sample indicates that the financial crisis had deeper effects than the COVID-19 pandemic, helping to support EP.
Figure. 4. Cooperatives’ profits
Source: Own elaboration. Data from SABI
Table 3 presents the patterns for financial profitability and its components, economic profitability, and leverage. Again, we used the ratios of the mean. The behaviour of cooperatives’ financial profitability displayed a tendency to increase. There were no significant effects from the COVID-19 pandemic. The figures in Table 3 and Figure 4 suggest that the main source of variation in FP is economic profitability rather than leverage. This variable indicates that the cooperatives’ degree of indebtedness did not change significantly as a consequence of the pandemic. However, as we mentioned in the second section, the problem lies in the high level thereof. Thus, cooperatives’ mean indebtedness in the 2008-2020 period was close to 70%, while for non-financial firms it was around 45%.[12]
Table. 3. Financial profitability and explanatory factors
|
FP |
L |
EP effect1 |
Leverage effect2 |
Interaction effect3 |
|
|
2008 |
3.79% |
2.99 |
|
|
|
|
2009 |
4.11% |
2.64 |
0.86 |
-0.44 |
-0.10 |
|
2010 |
3.61% |
2.69 |
-0.57 |
0.08 |
-0.01 |
|
2011 |
3.83% |
2.59 |
0.38 |
-0.15 |
-0.02 |
|
2012 |
4.14% |
2.63 |
0.25 |
0.06 |
0.00 |
|
2013 |
4.48% |
2.55 |
0.47 |
-0.12 |
-0.01 |
|
2014 |
4.83% |
2.54 |
0.38 |
-0.02 |
0.00 |
|
2015 |
5.71% |
2.52 |
0.92 |
-0.04 |
-0.01 |
|
2016 |
7.04% |
2.42 |
1.63 |
-0.23 |
-0.07 |
|
2017 |
6.33% |
2.36 |
-0.57 |
-0.15 |
0.01 |
|
2018 |
6.19% |
2.28 |
0.09 |
-0.22 |
0.00 |
|
2019 |
6.06% |
2.25 |
-0.05 |
-0.09 |
0.00 |
|
2020 |
5.95% |
2.24 |
-0.08 |
-0.03 |
0.00 |
1. EP effect = (EP2-EP1) * L1
2. Leverage effect = (L2-L1) * EP1
3. Interaction effect = (EP2-EP1) * (L2-L1)
(FP2-FP1) = 1+2+3
Source: Own elaboration. Data from SABI
Figure. 5. Explanatory factors of financial profitability
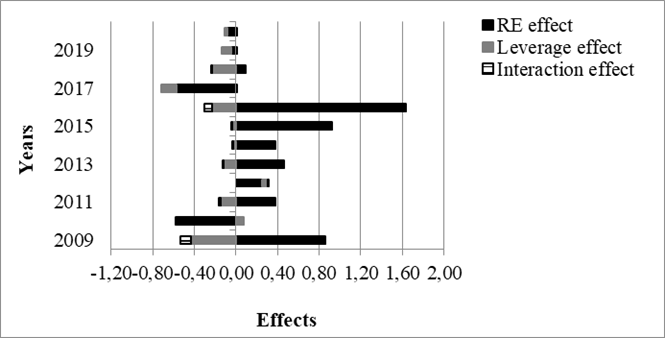
Source: Own elaboration. Data from SABI
The differences compared to non-financial firms are again significant. The evolution of the figures was as expected: EP was lower in cooperatives than in non-financial firms, meaning that its influence led to lower FP values. However, the COVID-19 pandemic implied that financial profitability of non-financial firms had fallen by almost 4 percentage points from 10.4% in 2019 to 6.7% in 2020. Many firms saw their profit levels contract by more than 50% (Menéndez and Mulino, 2021). In contrast, cooperatives’ FP was barely touched by the COVID-19 effect (Table 3).
4.3. Third objective: To assess whether belonging to a given activity sector affects cooperatives’ profitability
These general results can be qualified by disaggregating them according to activity sector. The sector to which cooperatives belong is assigned in accordance with the National Classification of Economic Activities (CNAE). Our breakdown of cooperatives puts them into five different sectors: primary sector; manufacturing (the food industry stands out); construction (the high figures reached in the Spanish economy are reproduced in cooperatives); trade (wholesale); the rest of the tertiary sector.
Table 4 shows the percentage breakdown of sample cooperatives by sector, and the average percentage of Spanish cooperatives. As we can see, the primary and the wholesale sectors are overrepresented compared to the rest of the tertiary sector. However, in our opinion, the sample allows for sound general conclusions to be drawn.
Table. 4. Breakdown of sample cooperatives by sector, and the Spanish average
|
% |
% Average (2016-2020)1 |
|
|
Primary sector |
28.6 |
13.9 |
|
Manufacturing |
19.5 |
18.2 |
|
Construction |
4.8 |
5.2 |
|
Wholesale |
27.9 |
19.0 |
|
Rest of tertiary |
19.2 |
43.7 |
1Social security contribution centres.
2016-2019: Fourth quarter data;
2020: Second quarter data
Source: Ministry of Labour and Social Economy
Table A.4 in the Appendix presents profitability information by sector. Among the main factors, it is worth highlighting the following:
1. The primary sector did not reach the levels of manufacturing EP and FP. However, after a slight fall in 2010, the numbers rebounded and survived the pandemic shock. It should be noted that this sector was essential during the pandemic. It is a strategic and essential sector that, to guarantee supplies and avoid food shortages, did not reduce its activity, unlike other non-essential sectors. In addition, a greater consumption of food during lockdown and interruptions of some external supplies allowed it to stay stronger (Montoriol-Garriga, 2020) .
2. The manufacturing sector lost EP due to the negative impacts of both the margin effect and the rotation effect, although the former was generally more intense. These falls had a negative effect on FP. Since the Spanish economy’s recovery in 2015, the manufacturing profitability level had been the highest. In relative terms, the impact of the COVID-19 pandemic was more significant than that of the Great Recession, but ratios retained a positive sign. This can be explained by the counter-cyclical behaviour of the food industry, which is fundamentally important to cooperatives.[13] In fact, it was the entire agri-food sector (primary sector plus food industry) that displayed this counter-cyclical behaviour. The health crisis revealed the strengths of agri-food cooperatives (Andrés González-Moralejo et al., 2021; Montoriol-Garriga, 2020; Randstad Holding SV, 2021). “Undoubtedly, one of the many lessons we can learn from the COVID-19 health crisis is the strategic importance of having a good agri-food system at the European level, with a concrete expression thereof in each country” (García Alvárez-Coque, 2020, p.21).
3. In Spain, construction was among the activities being forced to halt business at the end of March 2020. The ceasing of economic activity had serious impacts on firms’ results, as well as a significant impact on employment (Zaar and Ávila, 2020). Many firms took advantage of ERTEs.[14] However, the sector was hard hit by the health crisis, showing that it was an activity sensitive to economic cycles. Around 2016, cooperatives operating in the sector had begun to recover from the Great Recession; their profitability levels improved thanks to the margin effect. However, they were impacted by the health crisis. As in the years following the 2008 crisis, EP and FP again reached negative levels close to -4% and -6%, respectively (Table A.4 of the Appendix). This meant that, even under the cooperative model, it was a very pro-cyclical sector.
4. The wholesale sector displayed the lowest levels of EP and the highest levels of indebtedness. The COVID-19 pandemic did not have any significant effect on its profitability. Among the cooperatives, those dedicated to the wholesale of fruit and vegetables stood out. During the pandemic, they performed adequately while maintaining efficiency levels, although they had to solve certain problems arising from transportation, which meant greater liquidity needs (Briz et al., 2020).
5. The rest of the tertiary sector comprises more than 25 different activities, which makes it hard to establish general results. However, there are certain aspects that can indeed be highlighted. The Great Recession severely hit cooperatives linked to the catering industry, retail, transportation, and health activities. The worst figures were reached in 2012. In subsequent years, there were positive values in the data, but they were not a sign of recovery. The improvement in the 2019 and 2020 ratios was due to the margin effect. However, the activities that spearheaded the change were not the same. In 2019, activities linked to legal issues, business advice, and transportation stood out. In 2020, activities linked to health, care of older people and care in residential establishments were at the forefront. Retail trade, leisure, restaurants and transport were the ones that had the worst results. Regarding retail trade, e-commerce played a prominent role. According to (EMarketer, 2020), Spain was among the countries in which e-commerce displayed the most growth in 2020 (over 20%). And, according to Andújar et al. (2021) and González (2020), online purchases increased by 55% over the lockdown period. The results of the other activities displayed the negative effect of lockdown and cessation of economic activity.
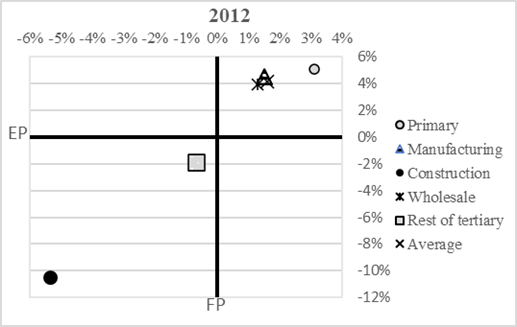
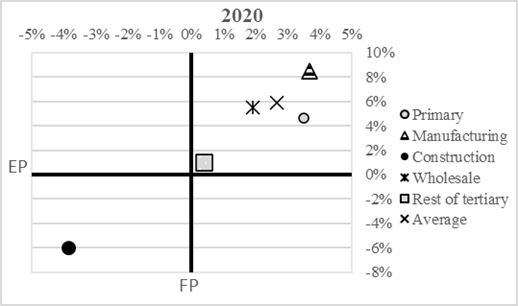
To summarise the evolution of cooperatives’ profitability, we have drawn three XY graphs for three different years: i) 2008, the first year that our study deals with; ii) 2012, the year with the worst growth in Spanish GDP; iii) 2020, the last year and that of the pandemic. EP is represented on the x-axis and FP is represented on the y-axis.
XY-Graphs: Cooperatives’ profitability over the period
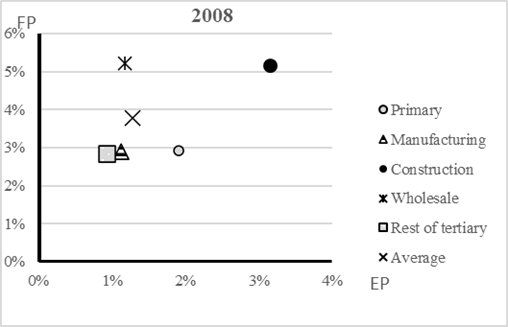
Source: SABI and own elaboration
The XY-graphs clearly show some of the facts that we have already emphasised:
i. The low levels of profitability ratios
ii. The improvement in absolute terms of the manufacturing sector’s profitability
iii. The capacity of the primary sector, manufacturing, and wholesale trade to maintain positive ratios in both crises
iv. The high pro-cyclical nature of the construction sector
5. Conclusions
This study investigated Spanish cooperatives’ performance. The period of analysis covered the years between 2008 and 2020. This period was not chosen at random but rather because it allowed us to analyse the Great Recession, the subsequent recovery, and the effects of the COVID-19 pandemic. The objectives linked two topics. On the one hand, we assessed how the number of cooperatives and their employment fared. On the other hand, we were interested in economic and financial profitability. These ratios indicate whether firms can survive, so their evolution helps to provide an understanding of whether the number of cooperatives and employment within them may or may not be in trouble.
Regarding the first objective, the results show that cooperatives and employment were lost. The variation rates reached negative levels, as in the worst years of the Great Recession. Employment figures fell more than they did in non-financial firms. Studies such as those by Cantanero et al. (2017); Musson and Rousselière (2018); Sala-Ríos et al. (2018); Sala et al., (2015) showed that the Great Recession increased the pro-cyclical behaviour of cooperatives’ employment. This study shows that evidence to that effect can also observed in the 2020 crisis. We conclude that in the first year of the COVID-19 pandemic, cooperatives demonstrated neither a refuge effect nor greater resilience.
However, these general results must be qualified because, when differentiating between self-employment and salaried employment, different features emerged. Specifically, a self-employment counter-cyclical phenomenon was found. The figures show that self-employment was less elastic than salaried employment, and its counter-cyclical behaviour was observed in both recovery and recession periods. Faced with declines in economic activity, the transformation of firms on the brink of closure into cooperatives, or the creation of cooperatives as a way of combatting unemployment may be behind this inverse correlation between crises and self-employment (Calderón and Calderón, 2012b; Grávalos and Pomares, 2001b; Lejarriaga and Martín, 2010; Martín and Lejarriaga, 2011). Hiring salaried workers is a longer-term process that requires a cooperative to demonstrate its ability to survive. When cooperatives are created in times of recession and under the circumstances described, their success and consolidation can be difficult, so recruiting employees is not among their short-term goals.
The second objective dealt with cooperatives’ economic performance by analysing two profitability ratios. The profitability results show that the COVID-19 crisis did not consistently affect cooperatives’ economic and financial ratios. They evolved comparatively better than those of non-financial firms. This could be taken as a strength and as some guarantee of survival. However, there are two weaknesses that must be considered. First, the absolute level of the ratios was relatively low. Second, profitability was highly dependent on profits. In fact, the main explanatory effect of economic profitability was the margin effect. And the main explanatory effect of financial profitability was economic profitability. Profits withstood the effect of the COVID-19 pandemic well. However, cooperatives’ high dependence on profits may undermine their possibility to cope with future external shocks. And more so if they do not favour, as the health crisis did, activities linked to the primary sector in which cooperatives stand out.
Our results also show that the degree of indebtedness did not change significantly during the analysis period. There is no evidence that the crises implied higher levels of indebtedness. Alarussi and Alhaderi (2018: 433), point out that “during a time of crisis; some firms attempt to preserve their financial status by undertaking risky measures, but due to limited experience and high risks, these kinds of actions more often than not result in worsening their financial status”. Cooperatives, in general, did not follow this path, probably because their mean indebtedness was already comparatively high.
We found that belonging to a specific activity sector was a dominant aspect in determining cooperatives’ profitability. The main results can be summarised as follows: i) The highest profitability values were found in manufacturing, but so too were the largest losses in downturns; ii) The pro-cyclical nature of construction and some tertiary sector activities; the crises were associated with more significant losses in their profitability than in other activities; iii) In 2020, activities linked to leisure, restaurants and transportation had the worst results; in contrast, the profitability of activities linked to health, care of older people and care in residential establishments improved; iv) The leading role of the food sector in times of crisis, despite its low profitability levels.
Indeed, despite the importance of cooperatives linked to the primary sector, some activities related to it had suffered from a lack of investment and serious structural problems. However, it withstood the Great Recession well and showed a counter-cyclical performance in the first year of the COVID-19 pandemic. The nature of the health crisis obviously helped. The increase in demand for food and the interruption of some foreign supply chains allowed the primary sector to become stronger. The goal now should be to recognise and address weaknesses and maintain the strategic position achieved to face future challenges. Albeit beyond our objectives, it is worth referring to the summary of these weaknesses and challenges made by Moyano (2020: 19): “There are certainly cooperatives [in the agri-food sector] , too many it could be said, but the reality is that they are very dispersed and fragmented and do not efficiently meet the objective of concentrating supply or improving their position in the food chain… Strategies for merging or concentration in second degree structures, or the establishment of commercial agreements between cooperatives without reaching their concentration, are necessary and very useful to improve the position of producers in markets.”
These results have practical implications for policymakers. Intervention in cooperatives should go beyond aid or subsidies. If policymakers really trust cooperatives as an alternative model, they should consider how to enhance the strengths they display, especially those linked to self-employment in times of crisis. In addition, our study found a low level of profitability inherent to cooperatives, as well as significant differences between sectors, and both should be taken into account when designing public policy measures.
Finally, we would like to highlight some limitations of this study. First, the analysis was approached using statistics that were not homogeneous. This makes comparison between the proposed objectives unviable. Second, profitability was analysed by taking firms active in 2020, a priori the strongest. Third, the 369 cooperatives making up the sample for the second and third objectives were those remaining after eliminating the ones presenting extreme and inconsistent values, as well as the ones without any information. This was the available sample for the purpose of analysing the proposed ratios. It was not possible to follow a consistent methodology in the sample selection process, e.g., sampling errors or confidence level. In addition, taking into account that the most recent figures showed that there were 18,035 cooperatives in Spain, our sample only accounted for 2% of the total. The implication of all this is that there might have been a certain lack of sample representativeness. Fourth, the analysis was performed using ratios designed and created by and for capitalist firms, which leads to an interpretation from a capitalist perspective. Finally, the legal nature of the link that associates a member-worker and a cooperative is a complex and controversial issue, which has generated doubts among lawmakers (Campos, 2021). This worker-firm relationship would require a specific analysis, which is not our focus here. We instead focus on the distinctive features of cooperatives from the perspective of the contractual relationship that is applied in capitalist firms. More interest and knowledge are needed in order to have available indicators and statistics that take account of the peculiarities of this alternative organisational model. Universities and educational centres must play a fundamental role in this by increasing levels of interest by and for the social economy.
6. References
Alarussi, A.S. and Alhaderi, S.M. (2018) Factors affecting profitability in Malaysia, Journal of Economic Studies, Vol. 45 No. 3, pp. 442–458.
Andrés González-Moralejo, S., García Cortés, M. and López Miquel, J.F. (2021) Are small and medium-size food industry firms profitable? Explaining differences in their performance: The case of the Valencia Region, Economia Agro-Alimentare, Vol. 23 No. 1, pp. 1–24.
Andújar, P., Góez, M. del M., Szydło, J. and Gulc, A. (2021) COVID-19 and the impact on the economy and society in Spain, Akademia Zarzadzania, Vol. 5 No. 2, pp. 183–197.
Banco de España. (2021) Informe Anual 2020, available at: https://www.bde.es/bde/es/secciones/informes/informes-y-memorias-anuales/informe-anual/index2020.html.
Basterretxea, I., Charterina, J. and Landeta, J. (2019) Coopetition and innovation. Lessons from worker cooperatives in the Spanish machine tool industry, Journal of Business and Industrial Marketing, Vol. 34 No. 6, pp. 1223–1235.
Basterretxea, I. and Storey, J. (2018) Do Employee-Owned Firms Produce More Positive Employee Behavioural Outcomes? If Not Why Not? A British-Spanish Comparative Analysis, British Journal of Industrial Relations, Vol. 56 No. 2, pp. 292–319.
Bastida, R. (2012) Cooperativas: Aspectos diferenciales, fortalezas y debilidades, Revista de Contabilidad y Dirección, Vol. 14, pp. 51–71.
Bastida Vialcanet, R. and Amat Salas, O. (2014) Efectos económicos de la primera aplicación de las normas contables adaptadas a la NIC 32 en las cooperativas, Revista de Contabilidad, Vol. 17 No. 2, pp. 201–211.
Ben-Ner, A. (1988) The life–cycle of worker-owned firms in market economies. A theorical analysis, Journal of Economic Behavior and Organization, Vol. 10 No. 3, pp. 287–313.
Birchall, J. and Ketilson, L.H. (2009) Resilience of the Cooperative Business Model in Times of Crisis., Geneva: ILO, International Labour Office, Job Creation and Enterprise Development Department, Geneva.
Blanco, R., Mayordomo, S., Menéndez, Á. and Mulino, M. (2020) El Impacto de La Crisis Del Covid-19 Sobre La Situación Financiera de Las Empresas No Financieras En 2020: Evidencia Basada En La Central de Balances, Banco de España, available at: https://repositorio.bde.es/bitstream/123456789/14241/1/be2004-art39.pdf.
Boone, Christophe; Özcan, S. (2014) Why do Cooperatives Emerge in a World Dominated by Corporations ? The Diffusion of Cooperatives in the U . S . Bio-ethanol Industry , 1978-2013 University of Antwerp Department of Management Department of Innovation and Organizational Economics, Academy of Management Journal, Vol. 57 No. 4, pp. 990–1012.
Bretos, I., Díaz-Foncea, M. and Marcuello, C. (2018) Cooperativas e internacionalización: Un análisis de las 300 mayores cooperativas del mundo”, CIRIEC-Espana Revista de Economia Publica, Social y Cooperativa, Vol. 92 No. 92, pp. 5–37.
Bretos, I., Errasti, A. and Marcuello, C. (2020) Is there life after degeneration ? The organizational life cycle of cooperatives under a ‘ grow-or-die ’ dichotomy, Annals of Public and Cooperative Economics, No. 91, pp. 435–457.
Bretos, I. and Marcuello, C. (2017) Revisiting Globalization Challenges and Opportunities in the Development of Cooperatives, Annals of Public and Cooperative Economics, Vol. 88 No. 1, pp. 47–73.
Briz, J., De Felipe, I. and Briz, T. (2020) Reflexiones sobre el impacto de la COVID-19 en la cadena de valor alimentaria, Distribución y Consumo, Vol. 2, pp. 55–60.
Calderón, B. and Calderón, M.J. (2012a) La calidad del empleo de las entidades de la economía social en el período de crisis, Ekonomiaz, Vol. 79, pp. 30–57.
Calderón, B. and Calderón, M.J. (2012b) Cómo afrontan la crisis las cooperativas en España: comparativa de trayectorias laborales a partir de la Muestra Continua de Vidas Laborales, CIRIEC-España, Revista de Economía Pública, Social y Cooperativa, No. 76, pp. 5–26.
Calderón Milán, B. (Universidad C.-L.M. and Calderón Milán, M.J. (Universidad C.-L.M. (2012) Cómo afrontan la crisis las cooperativas en España : comparativa de trayectorias laborales a partir de la Muestra Continua de Vidas Laborales, CIRIEC-España, Revista de Economía Pública, Social y Cooperativa, No. 76, pp. 5–26.
Campos, A.I.P. (2021) Socio trabajador de cooperativa de trabajo asociado, ¿asalariado y/o autónomo?: evolución, tendencias y nuevas propuestas, CIRIEC-España, Revista Jurídica de Economía Social y Cooperativa, No. 38, pp. 55–92.
Cantanero, S., González-Loureiro, M. and Puig, F. (2017) Efectos de la crisis económica sobre el emprendimiento en empresas de economía social en España: un análisis espacial, REVESCO. Revista de Estudios Cooperativos, Tercer Cuatrimestre, Nº 125, pp. 24–48. DOI: http://dx.doi.org/10.5209/REVE.56133.
Carini, C. and Carpita, M. (2014) The impact of the economic crisis on Italian cooperatives in the industrial sector, Journal of Co-Operative Organization and Management, Elsevier, Vol. 2 No. 1, pp. 14–23.
Castro, G., Monsalve, M.A., García, L. and Muñoz, A. (2019) Impacto de la localización en la rentabilidad económica, un modelo de efectos aleatorios con variable dependiente limitada para el caso de las empresas de Andalucía, 2008-2011, Documentos de Trabajo FCEA, No. 40, pp. 1–24.
Chaves, R. (2020) Crisis del Covid-19: impacto y respuestas de la economía social, Noticias de La Economía Pública, Social y Cooperativa, Vol. 63, pp. 28–43.
Child, J. (2021) Organizational participation in post-covid society–its contributions and enabling conditions, International Review of Applied Economics, Routledge, Vol. 35 No. 2, pp. 117–146.
Coque, J. (2008) Puntos fuertes y débiles de las cooperativas desde un concepto amplio de gobierno empresarial, REVESCO. Revista de Estudios Cooperativos, Segundo Cuatrimestre, Nº 95, pp. 65–93.
Cornforth, C. and Thomas, A. (1995) Les cooperatives de travail au Rouyaume- Uni. Declin ou croissance?, Revue de Etudes Cooperatives, Mutualistee et Associatives, Vol. 255 No. 53, pp. 17–22.
Cuadrado Roura, J., Llorente Heras, R. and Iglesias Fernández, F. (2005) El empleo autónomo en España: factores determinantes de su reciente evolución, CIRIEC - España. Revista de Economía Pública, Social y Cooperativa, No. 52, pp. 175–200.
Demoustier, D. (2000) Analysis of employment, The Enterprises and Organizations of the Third System: A Strategy Challenger for Employment, CIRIEC-International, pp. 36–56.
Díaz-Foncea, M. and Marcuello, C. (2013) Evolución del sector cooperativo en España, Artículo Presentado En La 4th International CIRIEC Research Conference on the Social Economy, Antwerp (Belgica).
Díaz-Foncea, M. and Marcuello, C. (2015) Spatial patterns in new firm formation: are cooperatives different?, Small Business Economics, Vol. 44 No. 1, pp. 171–187.
EMarketer. (2020) No Title, Global E-Commerce 2020, available at: https://www.emarketer.com/content/global-ecommerce-2020.
Fusco, F. and Migliaccio, G. (2018) Crisis, sectoral and geographical factors: financial dynamics of Italian cooperatives, EuroMed Journal of Business, Vol. 13 No. 2, pp. 130–148.
Fusco, F. and Migliacio, G. (2018) Cooperatives and crisis: Economic dynamics in Italian context, Euromed Journal of Business, Vol. 13 No. 2, pp. 130–148.
García Alvárez-Coque, J.M. (2020) La crisis de la COVID-19 plantea más preguntas que respuestas, Distribución y Consumo, Vol. 2, pp. 55–60.
González, A. (2020) How the coronavirus is affecting Spanish eCommerce: 12 studies on the impact of COVID-19 on online sales, Marketing Ecommerce, available at: https://marketing4ecommerce.net/como-esta-afectando-el-coronavirus-al-ecommerce-espanol-diferencias-sectores/.
González, A., Correa, A. and Acosta, M. (2002) Factores determinantes de la rentabilidad financiera de las pymes, Revista Española de Financiacion y Contabilidad, Vol. XXXI No. 112, pp. 395–429.
González Morales, M. (2009) Evolución del empleo autónomo en las regiones españolas y su relación con el crecimiento económico y el empleo, Revista de Estudios Regionales, No. 84, pp. 203–221.
Grávalos, M. and Pomares, I. (2001a) Cooperativas, desempleo y efecto refugio, REVESCO. Revista de Estudios Cooperativos, No. 74, pp. 69–84.
Grávalos, M. and Pomares, I. (2001b) La adaptación de las sociedades laborales a la evolución del ciclo económico: un estudio empírico para las diferentes comunidades autónomas, CIRIEC - España. Revista de Economía Pública, Social y Cooperativa, No. 38, pp. 33–56.
Guzmán, C., Santos, F.J. and Barroso, M. de la O. (2019) Analysing the links between cooperative principles, entrepreneurial orientation and performance, Small Business Economics, available at: https://doi.org/10.1007/s11187-019-00174-5.
Guzmán, C., Santos, F.J. and Barroso, M. de la O. (2020) Cooperative Essence and Entrepreneurial Quality: a Comparative Contextual Analysis, Annals of Public and Cooperative Economics, Vol. 91 No. 1, pp. 95–118.
Işık, Ö. (2017) Determinants of Profitability: Evidence from Real Sector Firms Listed in Borsa Istanbul, Business and Economics Research Journal, Vol. 4 No. 8, pp. 689–698.
Lampel, J., Bhalla, A. and Jha, P. (2012) The employee owned business model during growth and adversity: how well does it hold up?, European Business Review, Vol. July-Augus, pp. 20–23.
Lampel, J., Bhalla, A. and Jha, P. (2014) Does the governance confer organisational resilience? Evidence from UK employee owned businesses, European Management Journal, Vol. 32 No. 1, pp. 66–72.
Lejarriaga, G. and Martín, S. (2010) Las sociedades laborales, in Monzón, J. (Ed.), La Economía Social En España En El Año 2008, CIRIEC-España, Valencia, pp. 335–404.
Martín, S. and Lejarriaga, G. (2011) Las empresas de participación de trabajo asociado ante los desafíos del futuro en un contexto de crisis económica: propuestas de actuación, CIRIEC – España, Revista de Economía Pública, Social y Cooperativa, No. 72, pp. 239–261.
Melian, A. and Campos, V. (2010) Emprenedurismo y Economía social como mecanismo de inserción sociolaboral en tiempos de crisis, REVESCO. Revista de Estudios Cooperativos, No. 100 Extraordinario-Monográfico, pp. 43–67.
Menéndez, Á. and Mulino, M. (2021) Resultados de las empresas no financieras hasta el cuarto trimestre de 2020. Un avance de cierre del ejercicio, Boletín Económico - Banco de España, No. 2, pp. 1–16.
Montoriol-Garriga, J. (2020) La fortalesa del sector agroalimentari durant la crisi del coronavirus, Informe Sectorial Agroalimentario, CaixaBank Research, pp. 1–11.
Monzón, J.L. (2012) Las cooperativas ante la globalización: magnitudes, actividades y Tendencias., Ekonomiaz, No. 79, pp. 13–30.
Moyano, E. (2020) El sector agroalimentario después de la COVID-19, Distribución y Consumo, Vol. 2, pp. 14–22.
Musson, A. and Rousselière, D. (2018) Exploring the effect of crisis on cooperatives : A Bayesian performance analysis of French craftsmen cooperatives, Working Paper SMART – LERECO, No. 18–07.
Observatorio Socioeconómico del Cooperativismo Agroalimentario Español (OSCAE) (2019) El cooperativismo agroalimentario español. Informe socioeconómico 2019.
OECD (2020) Social Economy and the COVID-19 Crisis: Current and Future Roles, available at: http://www.oecd.org/coronavirus/policy-responses/social-economy-and-the-covid-19-crisis-current-and-future-roles-f904b89f/.
Park, R., Kruse, D. and Sesil, J. (2004) Does employee ownership enhance firm survival?, in Perotin, V. and Robinson, A. (Ed.), Employee Participation, Firm Performance and Survival (Advances in the Economic Analysis of Participatory & Labor-Managed Firms, Vol. 8), Emerald Group Publishing Limited., Bingley, pp. 3–33.
Pérotin, V. (2006) Entry, exit, and the business cycle: Are cooperatives different?, Journal of Comparative Economics, Vol. 34 No. 2, pp. 295–316.
Prades Illanes, E. and Tello Casas, P. (2020) Heterogeneidad En El Impacto Económico Del Covid-19 Entre Regiones y Países Del Área Del Euro, Boletín Económico/Banco de España.
Randstad Holding SV. (2021) Industria de La Alimentación. Impacto Del Covid-19 En Las Empresas Del Sector y Horizonte de Recuperación, Randstad Holding SV, available at:
Roelants, B., Dovgan, D., Eum, H. and Terrasi, E. (2012) The Resilience of the Cooperative Model, CECOP-CICOPA Europe, available at: https://doi.org/10.1128/CVI.00435-06.
Román, C.A. (2014) Las cooperativas españolas y los ciclos económicos. Un análisis comparado, CIRIEC - España. Revista de Economía Pública, Social y Cooperativa, No. 80, pp. 77–110.
Sala-Ríos, M.; Farré-Perdiguer, M.; Torres-Solé, T. (2020) Cooperative employment cycles in Spain. Does regional localization matter?. REVESCO. Revista de Estudios Cooperativos, vol. 136, e71857.
https://dx.doi.org/10.5209/reve.71857.
Sala-Ríos, M., Farré-Perdiguer, M. and Torres-Solé, T. (2020b) Exporting and Firms ’ Performance — What about Cooperatives ? Evidence from Spain, Sustainability, Vol. 12 No. 8385, pp. 1–22.
Sala-Ríos, M., Torres-Solé, T. and Farré-Perdiguer, M. (2018) Demografía de las cooperativas en tiempos de crisis, CIRIEC-España, Revista de Economía Pública, Social y Cooperativa, No. 93, pp. 51–84.
Sala, M., Torres, T. and Farré, M. (2015) El empleo de las cooperativas. Un análisis comparativo de sus fases cíclicas y de su grado de sincronización, CIRIEC-España, Revista de Economía Pública, Social y Cooperativa, Vol. 83 No. 83, pp. 115–141.
Sala Ríos, M., Farré Perdiguer, M. and Torres Solé, T. (2014) Un análisis del comportamiento cíclico de las cooperativas y sociedades laborales españolas y de su relación con la actividad económica, REVESCO Revista de Estudios Cooperativos, Nº 115, pp. 7-29. DOI: https://doi.org/10.5209/rev_REVE.2014.v115.45279.
Sánchez, A. (1994) La rentabilidad económica y financiera de la gran empresa española. Análisis de los factores determinantes, Revista Española de Financiación y Contabilidad, Vol. 23 No. 78, pp. 159–179.
Tarazona, P. and Albors, J. (2005) La economía social y el desarrollo local, Revista Nacional Del CIDEC, No. 45, pp. 70–75.
Vázquez Rodríguez, M.R. (2005) Estudio del modelo de descomposición de la rentabilidad económica según el enfoque Du Pont., In Cities in Competition. Finance Management Challenges: Selected Papers from the XV Spanish-Portuguese Meeting of Scientific Management, pp. 295-306.
Vo, C.S. (2017) Between the local and the global: An analysis of economic tensions in cooperatives’ practices, International Social Work, SAGE PublicationsSage UK: London, England, Vol. First Publ, available at: https://doi.org/10.1177/0020872817717321.
Zaar, M.H. and Ávila, M.-B.G. (2020) El Covid-19 en España y sus primeras consecuencias, Espaço e Economia, No. 17, pp. 1–21.
Internet Sources
Banco de España. Central de Balances. Ratios trimestrales acumulados (2020), available at:
https://app.bde.es/asc_web/consulta.html.
Banco de España. Central de Balances. Ratios trimestrales acumulados (2020), available at:
https://www.bde.es/webbde/es/estadis/infoest/temas/sb_cbratios.html.
Ministerio de Trabajo y economía Social (2020), available at:
https://www.mites.gob.es/es/Guia/texto/guia_2/contenidos/guia_2_7_5.htm.
Ministerio de Trabajo y economía Social (2020), available at:
Ministerio de Trabajo y economía Social (2020), available at:
Appendix:
Table. A.4. Activity sector: EP, FP and effects
|
Primary |
EP |
M |
R |
Margin effect |
Rotation effect |
Interaction effect |
FP |
|
L |
RE effect |
L effect |
interaction effect |
|
2008 |
1.90% |
1.34% |
1.42 |
2.93% |
|
1.54 |
||||||
|
2009 |
1.32% |
1.19% |
1.10 |
-0.00207 |
-0.00429 |
0.00047 |
2.07% |
|
1.57 |
-0.00907 |
0.00066 |
-0.00020 |
|
2010 |
0.94% |
0.86% |
1.09 |
-0.00373 |
-0.00008 |
0.00002 |
1.48% |
|
1.58 |
-0.00595 |
0.00015 |
-0.00004 |
|
2011 |
1.87% |
1.52% |
1.24 |
0.00723 |
0.00120 |
0.00093 |
2.91% |
|
1.55 |
0.01483 |
-0.00029 |
-0.00029 |
|
2012 |
3.08% |
2.57% |
1.20 |
0.01303 |
-0.00055 |
-0.00039 |
5.07% |
|
1.65 |
0.01879 |
0.00174 |
0.00113 |
|
2013 |
2.16% |
1.78% |
1.21 |
-0.00947 |
0.00034 |
-0.00010 |
3.31% |
|
1.53 |
-0.01520 |
-0.00349 |
0.00104 |
|
2014 |
2.78% |
2.51% |
1.11 |
0.00884 |
-0.00187 |
-0.00077 |
4.26% |
|
1.53 |
0.00952 |
-0.00001 |
0.00000 |
|
2015 |
1.92% |
1.79% |
1.07 |
-0.00799 |
-0.00086 |
0.00025 |
2.91% |
|
1.51 |
-0.01318 |
-0.00053 |
0.00016 |
|
2016 |
2.86% |
2.76% |
1.03 |
0.01044 |
-0.00069 |
-0.00038 |
3.93% |
|
1.38 |
0.01419 |
-0.00264 |
-0.00129 |
|
2017 |
2.52% |
2.55% |
0.99 |
-0.00217 |
-0.00134 |
0.00010 |
3.58% |
|
1.42 |
-0.00469 |
0.00132 |
-0.00016 |
|
2018 |
2.89% |
2.94% |
0.98 |
0.00380 |
-0.00003 |
0.00000 |
3.99% |
|
1.38 |
0.00536 |
-0.00109 |
-0.00016 |
|
2019 |
3.71% |
3.71% |
1.00 |
0.00762 |
0.00046 |
0.00012 |
4.92% |
|
1.33 |
0.01132 |
-0.00156 |
-0.00044 |
|
2020 |
3.50% |
3.66% |
0.96 |
-0.00050 |
-0.00165 |
0.00002 |
4.64% |
|
1.33 |
-0.00282 |
-0.00002 |
0.00000 |
|
Manufacturing |
EP |
M |
R |
Margin effect |
Rotation effect |
Interaction effect |
FP |
|
L |
RE effect |
L effect |
interaction effect |
|
2008 |
1.12% |
0.90% |
1.25 |
2.90% |
|
2.59 |
||||||
|
2009 |
1.16% |
1.00% |
1.16 |
0.00131 |
-0.00084 |
-0.00010 |
2.70% |
|
2.34 |
0.00096 |
-0.00280 |
-0.00009 |
|
2010 |
0.96% |
0.86% |
1.12 |
-0.00160 |
-0.00042 |
0.00006 |
2.29% |
|
2.39 |
-0.00460 |
0.00062 |
-0.00010 |
|
2011 |
1.40% |
1.13% |
1.24 |
0.00303 |
0.00107 |
0.00034 |
4.33% |
|
3.08 |
0.01060 |
0.00666 |
0.00308 |
|
2012 |
1.51% |
1.12% |
1.35 |
-0.00017 |
0.00120 |
-0.00001 |
4.46% |
|
2.96 |
0.00313 |
-0.00172 |
-0.00012 |
|
2013 |
1.22% |
0.87% |
1.40 |
-0.00339 |
0.00063 |
-0.00014 |
3.52% |
|
2.90 |
-0.00860 |
-0.00092 |
0.00018 |
|
2014 |
2.27% |
1.56% |
1.45 |
0.00978 |
0.00045 |
0.00036 |
6.67% |
|
2.93 |
0.03071 |
0.00039 |
0.00034 |
|
2015 |
4.38% |
2.86% |
1.53 |
0.01885 |
0.00123 |
0.00102 |
12.02% |
|
2.74 |
0.06181 |
-0.00430 |
-0.00398 |
|
2016 |
6.31% |
3.99% |
1.58 |
0.01730 |
0.00141 |
0.00056 |
15.17% |
|
2.40 |
0.05282 |
-0.01479 |
-0.00650 |
|
2017 |
5.46% |
3.54% |
1.54 |
-0.00712 |
-0.00151 |
0.00017 |
12.96% |
|
2.37 |
-0.02034 |
-0.00206 |
0.00028 |
|
2018 |
4.70% |
3.00% |
1.57 |
-0.00838 |
0.00092 |
-0.00014 |
10.61% |
|
2.26 |
-0.01803 |
-0.00636 |
0.00089 |
|
2019 |
4.65% |
3.03% |
1.53 |
0.00053 |
-0.00107 |
-0.00001 |
10.40% |
|
2.24 |
-0.00126 |
-0.00087 |
0.00001 |
|
2020 |
3.68% |
2.51% |
1.47 |
-0.00795 |
-0.00203 |
0.00035 |
8.53% |
|
2.31 |
-0.02155 |
0.00359 |
-0.00075 |
|
Construction |
EP |
M |
R |
Margin effect |
Rotation effect |
Interaction effect |
FP |
|
L |
RE effect |
L effect |
interaction effect |
|
2008 |
3.15% |
3.10% |
1.02 |
5.16% |
|
1.64 |
||||||
|
2009 |
16.62% |
12.39% |
1.34 |
0.09445 |
0.01007 |
0.03023 |
28.28% |
|
1.70 |
0.22101 |
0.00192 |
0.00823 |
|
2010 |
2.90% |
3.92% |
0.74 |
-0.11368 |
-0.07435 |
0.05085 |
4.19% |
|
1.44 |
-0.23337 |
-0.04286 |
0.03537 |
|
2011 |
-0.76% |
-1.50% |
0.51 |
-0.04013 |
-0.00904 |
0.01249 |
-1.16% |
|
1.52 |
-0.05293 |
0.00216 |
-0.00273 |
|
2012 |
-5.35% |
-12.84% |
0.42 |
-0.05794 |
0.00140 |
0.01063 |
-10.46% |
|
1.95 |
-0.06968 |
-0.00332 |
-0.01999 |
|
2013 |
-0.98% |
-2.18% |
0.45 |
0.04447 |
-0.00429 |
0.00356 |
-2.10% |
|
2.14 |
0.08544 |
-0.01012 |
0.00827 |
|
2014 |
-0.45% |
-1.01% |
0.44 |
0.00526 |
0.00019 |
-0.00010 |
-0.84% |
|
1.88 |
0.01145 |
0.00259 |
-0.00141 |
|
2015 |
-3.89% |
-6.23% |
0.63 |
-0.02305 |
-0.00185 |
-0.00958 |
-6.78% |
|
1.74 |
-0.06474 |
0.00061 |
0.00473 |
|
2016 |
0.26% |
0.50% |
0.52 |
0.04206 |
0.00635 |
-0.00686 |
0.44% |
|
1.67 |
0.07233 |
0.00276 |
-0.00295 |
|
2017 |
1.01% |
1.46% |
0.69 |
0.00504 |
0.00082 |
0.00158 |
1.57% |
|
1.56 |
0.01243 |
-0.00028 |
-0.00080 |
|
2018 |
1.88% |
2.26% |
0.83 |
0.00552 |
0.00206 |
0.00113 |
2.69% |
|
1.43 |
0.01360 |
-0.00129 |
-0.00112 |
|
2019 |
0.69% |
0.92% |
0.75 |
-0.01112 |
-0.00181 |
0.00107 |
1.02% |
|
1.48 |
-0.01700 |
0.00080 |
-0.00051 |
|
2020 |
-3.85% |
-4.36% |
0.88 |
-0.03954 |
0.00125 |
-0.00714 |
-5.96% |
|
1.55 |
-0.06709 |
0.00049 |
-0.00322 |
|
Wholesale trade |
EP |
M |
R |
Margin effect |
Rotation effect |
Interaction effect |
FP |
|
L |
RE effect |
L effect |
interaction effect |
|
2008 |
1.17% |
0.55% |
2.13 |
5.23% |
|
4.47 |
||||||
|
2009 |
1.65% |
0.79% |
2.09 |
0.00511 |
-0.00019 |
-0.00008 |
6.04% |
|
3.65 |
0.02161 |
-0.00954 |
-0.00394 |
|
2010 |
1.72% |
0.84% |
2.04 |
0.00110 |
-0.00044 |
-0.00003 |
6.44% |
|
3.75 |
0.00228 |
0.00160 |
0.00006 |
|
2011 |
1.49% |
0.70% |
2.13 |
-0.00287 |
0.00075 |
-0.00013 |
4.39% |
|
2.94 |
-0.00841 |
-0.01385 |
0.00181 |
|
2012 |
1.28% |
0.60% |
2.14 |
-0.00220 |
0.00008 |
-0.00001 |
3.91% |
|
3.06 |
-0.00628 |
0.00172 |
-0.00025 |
|
2013 |
1.95% |
0.91% |
2.15 |
0.00658 |
0.00006 |
0.00003 |
5.84% |
|
3.00 |
0.02038 |
-0.00071 |
-0.00037 |
|
2014 |
1.52% |
0.71% |
2.13 |
-0.00411 |
-0.00018 |
0.00004 |
4.51% |
|
2.97 |
-0.01275 |
-0.00068 |
0.00015 |
|
2015 |
1.48% |
0.73% |
2.04 |
0.00024 |
-0.00060 |
-0.00001 |
4.46% |
|
3.01 |
-0.00111 |
0.00064 |
-0.00002 |
|
2016 |
1.51% |
0.75% |
2.01 |
0.00047 |
-0.00024 |
-0.00001 |
4.74% |
|
3.15 |
0.00068 |
0.00206 |
0.00003 |
|
2017 |
1.51% |
0.73% |
2.07 |
-0.00033 |
0.00043 |
-0.00001 |
4.52% |
|
2.98 |
0.00028 |
-0.00246 |
-0.00001 |
|
2018 |
1.81% |
0.88% |
2.07 |
0.00302 |
-0.00002 |
0.00000 |
5.29% |
|
2.92 |
0.00895 |
-0.00105 |
-0.00021 |
|
2019 |
1.42% |
0.67% |
2.11 |
-0.00430 |
0.00043 |
-0.00010 |
4.15% |
|
2.93 |
-0.01160 |
0.00028 |
-0.00006 |
|
2020 |
1.91% |
0.89% |
2.14 |
0.00464 |
0.00020 |
0.00007 |
5.48% |
|
2.87 |
0.01438 |
-0.00083 |
-0.00029 |
|
Rest of tertiary |
EP |
M |
R |
Margin effect |
Rotation effect |
Interaction effect |
FP |
|
L |
RE effect |
L effect |
interaction effect |
|
2008 |
0.92% |
0.42% |
2.18 |
2.83% |
|
3.09 |
||||||
|
2009 |
-0.34% |
-0.19% |
1.77 |
-0.01332 |
-0.00175 |
0.00254 |
-1.04% |
|
3.10 |
-0.03871 |
0.00004 |
-0.00005 |
|
2010 |
-0.77% |
-0.38% |
2.05 |
-0.00328 |
-0.00054 |
-0.00053 |
-2.36% |
|
3.06 |
-0.01347 |
0.00012 |
0.00016 |
|
2011 |
-0.17% |
-0.07% |
2.27 |
0.00621 |
-0.00082 |
0.00066 |
-0.46% |
|
2.79 |
0.01849 |
0.00205 |
-0.00161 |
|
2012 |
-0.68% |
-0.31% |
2.20 |
-0.00542 |
0.00006 |
0.00018 |
-1.86% |
|
2.72 |
-0.01446 |
0.00011 |
0.00036 |
|
2013 |
0.61% |
0.27% |
2.25 |
0.01283 |
-0.00015 |
0.00029 |
1.62% |
|
2.65 |
0.03529 |
0.00052 |
-0.00098 |
|
2014 |
0.21% |
0.09% |
2.20 |
-0.00400 |
-0.00013 |
0.00008 |
0.59% |
|
2.84 |
-0.01072 |
0.00118 |
-0.00078 |
|
2015 |
-0.11% |
-0.05% |
2.20 |
-0.00312 |
0.00000 |
0.00000 |
-0.32% |
|
3.07 |
-0.00887 |
0.00048 |
-0.00072 |
|
2016 |
-0.16% |
-0.08% |
1.99 |
-0.00071 |
0.00010 |
0.00007 |
-0.48% |
|
2.98 |
-0.00166 |
0.00009 |
0.00005 |
|
2017 |
0.36% |
0.18% |
1.99 |
0.00523 |
0.00000 |
0.00000 |
1.18% |
|
3.25 |
0.01559 |
-0.00043 |
0.00140 |
|
2018 |
-0.44% |
-0.22% |
1.98 |
-0.00801 |
-0.00002 |
0.00003 |
-1.40% |
|
3.22 |
-0.02598 |
-0.00012 |
0.00025 |
|
2019 |
0.15% |
0.07% |
2.02 |
0.00584 |
-0.00009 |
0.00012 |
0.45% |
|
3.01 |
0.01889 |
0.00090 |
-0.00121 |
|
2020 |
0.36% |
0.19% |
1.89 |
0.00238 |
-0.00010 |
-0.00015 |
1.06% |
|
2.90 |
0.00643 |
-0.00016 |
-0.00023 |
Source: SABI and own elaboration